|
|
||
|---|---|---|
| src | ||
| .dir-locals.el | ||
| .gitignore | ||
| Interaction snapshot.png | ||
| LICENCE | ||
| README.md | ||
| index.html | ||
| package.json | ||
| rollup.config.js | ||
| style.css | ||
| tsconfig.json | ||
| yarn.lock | ||
README.md
Capturing and rendering Syndicated Actor Model interaction traces
- Trace schema: [syndicate-protocols]/schemas/trace.prs
- Trace rendering tool: syndicate-render-msd
The syndicate-server program
is able to capture traces of all Syndicated Actor Model
interactions that traverse it, saving them as TraceEntry records (defined in trace.prs)
to a file for later analysis.
Recording a trace
To record a trace, start syndicate-server with the -t <trace-file> (or --trace-file <trace-file>) command-line options. All interactions will be recorded in the named file.
The contents of the file will look a bit like this:
<trace 1643236405.7954443 1 <start <anonymous>>>
<trace 1643236405.7959989 11 <start <named dependencies_listener>>>
<trace 1643236405.7960189 21 <start <named config_watcher>>>
<trace 1643236405.7960294 31 <start <named daemon_listener>>>
<trace 1643236405.7960389 41 <start <named debt_reporter_listener>>>
<trace 1643236405.7960542 51 <start <named milestone_listener>>>
<trace 1643236405.7960613 61 <start <named tcp_relay_listener>>>
<trace 1643236405.7960687 71 <start <named unix_relay_listener>>>
<trace 1643236405.7960766 81 <start <named logger>>>
<trace 1643236405.7960895 1 <turn 9 <external "top-level actor"> [<facet-start [12 2]> <spawn #f 11> <spawn #f 21> <spawn #f 31> <spawn #f 41> <spawn #f 51> <spawn #f 61> <spawn #f 71> <enqueue <event <entity 1 12 140358591713488> <assert <value <run-service <config-watcher "config" {config: #!"1/12:00007fa7c80010d0" gatekeeper: #!"1/12:00007fa7c8005420" log: #!"1/12:00007fa7c80011b0"}>>> 3>>> <spawn #f 81>]>>
<trace 1643236405.7961453 1 <turn 29 <caused-by 9> [<dequeue <event <entity 1 12 140358591713488> <assert <value <run-service <config-watcher "config" {config: #!"1/12:00007fa7c80010d0" gatekeeper: #!"1/12:00007fa7c8005420" log: #!"1/12:00007fa7c80011b0"}>>> 3>>>]>>
<trace 1643236405.7962394 81 <turn 49 <caused-by 9> [<facet-start [122 92]> <enqueue <event <entity 1 12 140358591713712> <assert <value <Observe <rec log [<bind <_>> <bind <_>>]> #!"81/122:00007fa7c800ff10">> 13>>>]>>
<trace 1643236405.796323 11 <turn 19 <caused-by 9> [<facet-start [102 22]> <enqueue <event <entity 1 12 140358591713488> <assert <value <Observe <rec require-service [<bind <_>>]> #!"11/102:00007fa75c0010b0">> 23>>>]>>
...
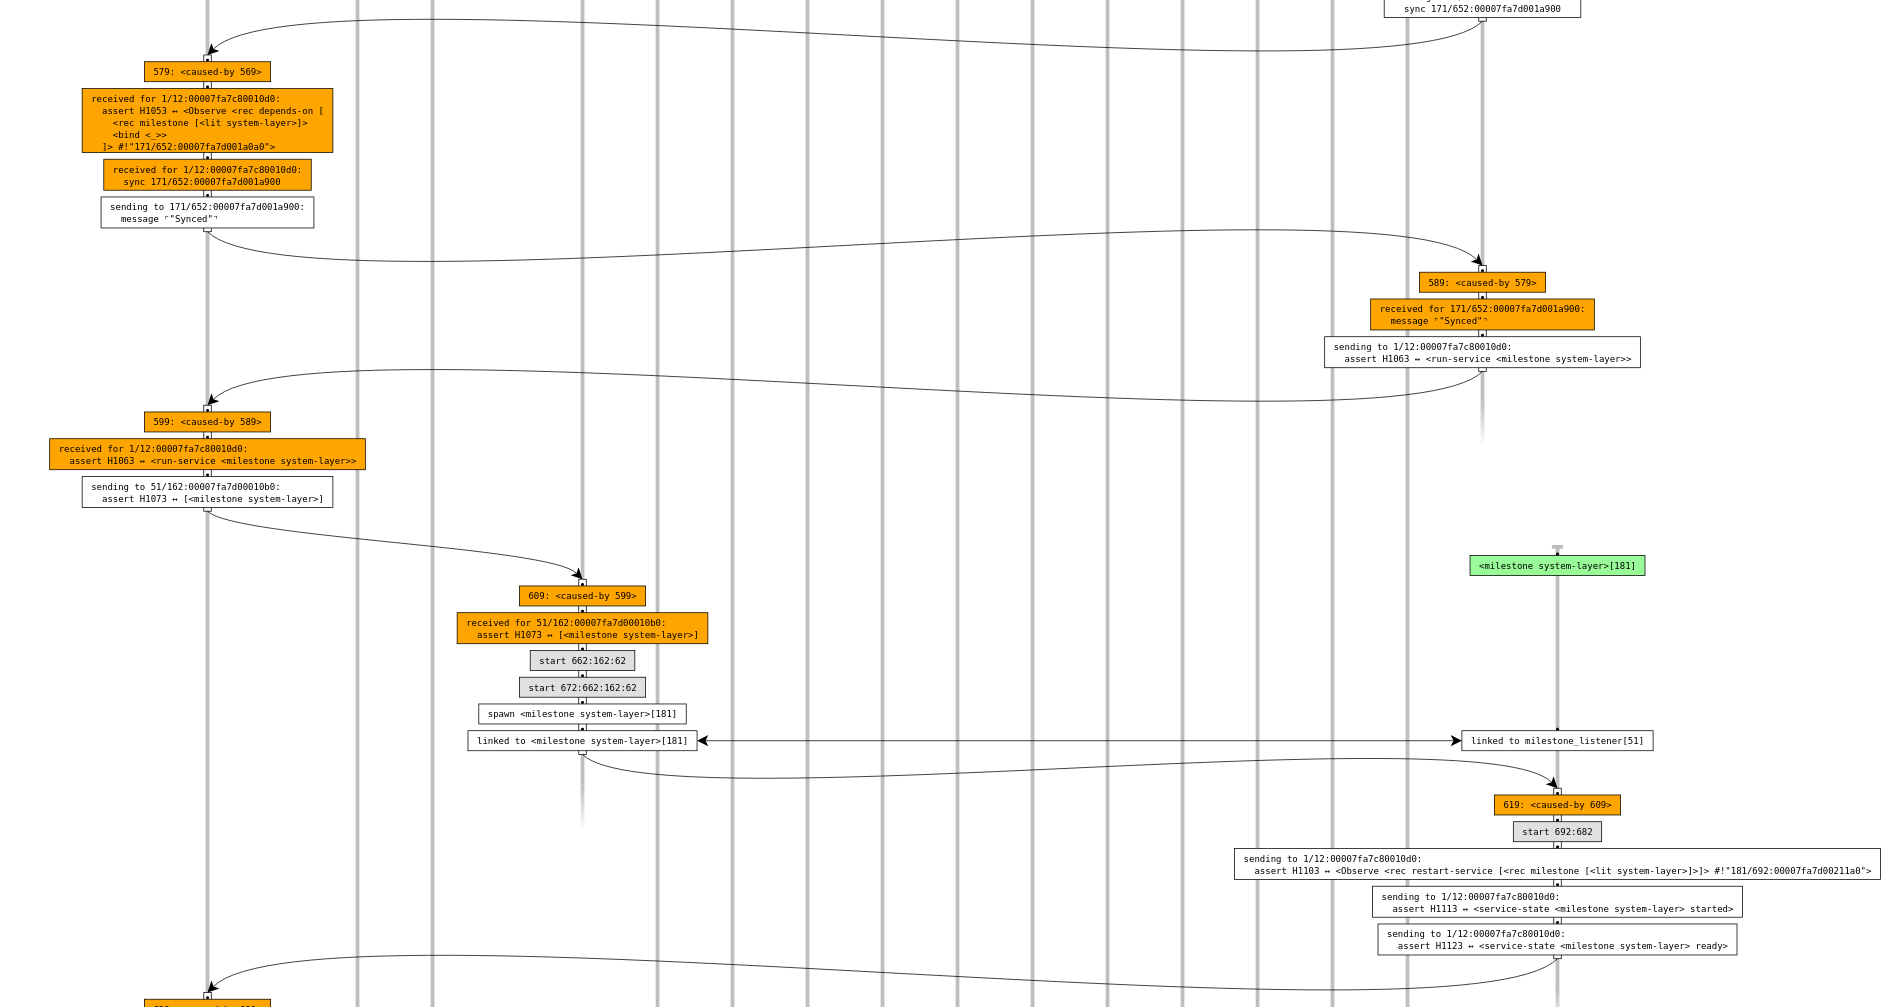
Rendering a trace
Tools such as syndicate-render-msd can process trace files to produce message-sequence-diagram-like interactive renderings of their contents. The trace file excerpted above renders (in part) in the browser to the following screenshot:
Enhancements such as streaming of a live trace and filtering and selecting subtraces are on the roadmap.